Your Our eyes deceive you Us, use The Force
(Reader Note: this is a technical/wonk-ish post about statistical models)
Update 3/23/2017
LOESS regressions have been on my mind lately and I wanted to update this post with the disclaimer: do not use them. Some day I’ll get around to talking to Kahan about why.
Update 1/5/14
Filing under further correction/un-retraction. The R^2 values for the two separate groups are 0.08 and 0.10 for Egal. Communitarian and Hier. Individualist respectively. Much much lower than the original 0.45 reported. Significantly non-zero? yes, I misspoke claiming there was “zero” relationship. But it is clearly not where most of the information is.
Update 1/3/14
Filing under Corrections/Retractions/Additions. Professor Kahan took an interest in the position I was trying to make and we had a nice and long conversation through email. He brought up a lot of good points challenging my simulation, and even provided me with some data! (which I’ll take a look at soon) I have left my post unedited and posted his very thoughtful response in its entirety down below. I maintain that the original question of “who are these outliers” is specifically looking for people whose environmental risk perceptions are the opposite sign of their cohort’s (those are the ones circled after all). This implies that we have a grouping or classification question asking for conditional relationships that generate outliers.[3] In the end, I think we agree that an OLS might not be the best way to attack this. In order for me to accurately test my ideas, Kahan has graciously offered to provide me with any data that I’d like. This will be fun.
Outliers
This past week, professor Dan Kahan made a post over on the blog of Yale’s Cultural Cognition Project. In it he challenges readers to formulate a hypothesis that explains outliers in a data set. He sets it up as follows:
Here is a scatter plot that arrays about 1000 “egalitarian communitarian” (green) and “hierarchical individualist” (black) outlooks (determined by their score in relation to the mean on the “hierarchy-egalitarian” and “individualist-communitarian” worldview scales) in relation to their environmental risk perceptions, which are measured with an aggregate Likert scale that combines responses to the “industrial strength” risk perception measure as applied to global warming, nuclear power, air pollution, fracking, and second-hand cigarette smoke (Cronbach’s alpha = 0.89).
You can see how strongly correlated the cultural outlooks are with risk perceptions.
When I regress the environmental risk perception measure on the cultural outlook scales (using the entire N = 1928 sample), I get an “impressively large!” R^2 = 0.45 (to me, any R^2 that is higher than that for viagra use in explaining abatement of “male sexual dysfunction” is “impressively large!”). That means 45% of the variance is accounted for by cultural worldviews — & necessary that 55% of the variance is still to be “explained.”
But here’s a more useful way to think of this. Look at the folks in the dashed red “outlier” circles. These guys/gals have formed perceptions of risk that are pretty out of keeping with that of the vast majority of those who share their outlooks.
What makes them tick?

After showing us the print out of the standard test statistics of the OLS, Kahan then asks readers to think of additional variables to add to the regression (proposed in the form of a hypothesis of some social theory) so that it might explain the remainder of the variance.
But there’s a glaring problem with the way this exercise is set up. Look at the above plot. Now cover up just the black data points. Do you still see a relationship in the data? Try it again by covering up the green data points. The problem here: there is no intragroup relationship in the data – i.e. the magnitude of a person’s Cultural Outlook is not associated with the magnitude of their Environmental Risk Perception. Therefore, it does not make much sense to use an OLS! To support this argument I will simulate Kahan’s data and apply the model.[1]
Prediction vs. Inference
Before we continue, the Simply Statistics blog recently hosted an “un-conference” on google hangout. The topic was “the future of statistics.” I enjoyed the diverse panel of (mostly) young professors and professionals talking about the major strides that have been made in statistics, and then also what we aren’t very good at yet. Watch it.
One recurring theme of the un-conference was the distinction between prediction and inference. Daniela Witten, assistant professor of biostatistics at the University of Washington, gives an example: “given the purchases you’ve made on amazon if I ask what else you might want to buy, that’s a prediction problem. But if instead I ask how certain I am that you’re gonna wanna buy those things, if i ask for a confidence interval, then that’s an inference problem.” She further notes that we’ve become very good at prediction problems using machine learning techniques, but we’re still relatively weak in inference.
In Kahan’s post, by using a linear regression to model the data and reporting the r^2, he is explicitly framing the problem in the domain of inference. However, since the magnitudes have no relationship, the linear estimator’s associated test statistics are not reliable. Instead, the problem we’re looking at is actually one of prediction, specifically of classification. From the data, all we can do is predict whether or not someone belongs to a class (Environmental Risk+, or Environmental Risk-) based on their membership of another class (Egal. communitarian, or Hier. individualist).
Simulating The Data
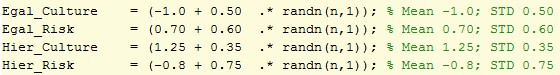
In Matlab I set up two groups like in the graph Kahan has shown. Then from eyeballing the horizontal and vertical distributions of the data, I populated the cultural outlooks and environmental risk perceptions from independent normal distributions of varying means and standard deviations. (If you want to play along at home, the rng seed is 1234 and the n for each group is 500)
Then I combined the culture and risk vectors into total population vectors to perform the OLS like in the original post. Graphed:
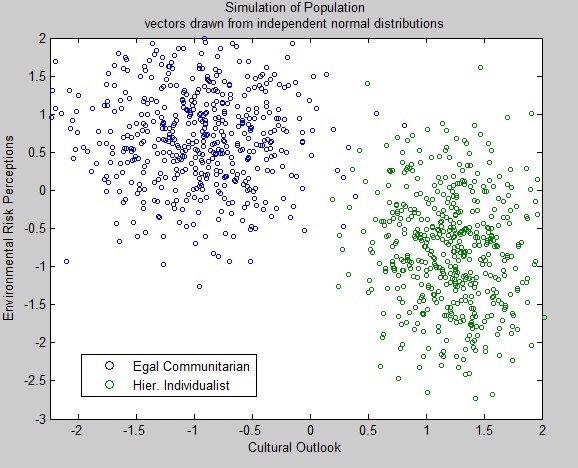
This looks very similar to the data Kahan is using. Further, applying a linear regression on the population vectors gives us a nearly identical r^2! The trick here is that by generating all of the x,y pairs from independent normal distributions, the relationship between the magnitudes of the cultural outlooks and the environmental risk perceptions is defined as 0. Thus, knowing that a data point’s cultural outlook is +2 does not give you any more information than if it were +1. If we used the linear estimator to predict the confidence interval of our prediction at +2, we would be falsely overconfident relative to +1.[2]
So what then?
For starters, I think this tells us that it’s incorrect to frame the problem in terms of trying to explain more of the variance in a regression. This is a classification problem — one of prediction. By classifying everything to the right of 0 as Hier., left as Egal, and everything above 0 as Risk+, below as Risk-, we immediately see that we might be pretty good at predicting the class.
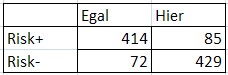
If we had naively guessed that all egalitarian communitarians were Risk+, and all hierarchical individualists were Risk-, we’d have been right 84% of the time. As a classification question, Kahan’s goal now becomes adding new classes that have a conditional relationship with Risk. However, this becomes increasingly difficult as only 16% remains unaccounted for (assuming the sample is representative). We could find another classifier that is correct 80% of the time, but it still might not give us any additional information because of its correlation to cultural outlook.
My final answer
Even if Kahan manages to explain more of the variance in his current sample, the regression will not have any out of sample predictive power — i.e. it will not generalize to another sample. Re-state the problem in the domain of prediction to increase your chances of making a statistically useful discovery.
—
Addendum
Gary Basin, sent me an applicable statistical paradox called Simpson’s Paradox where “a trend that appears in different groups of data disappears when these groups are combined, and the reverse trend appears for the aggregate data.”

Professor Kahan’s Thoughts
Thanks for the cool response to my “explain my noise” challenge, Zachary!
I agree with you that “increasing the R2” is almost certainly not a helpful way to go about explaining nonconformity of the sort that I was trying to focus on. Agree, too, that other statistical methods might well be better suited for testing interesting hypotheses here than is OLS regression.
But I do think you are in error to conclude that there is something about the structure of the data I reported that makes linear regression unsuited for analyzing the relationship between “cultural worldviews” and environmental risk perceptions generally.
As you wisely counsel, one shouldn’t trust one’s eyes when analyzing data. Or to quote a famous statistician (I just can’t remember his name but I do remember that he himself seemed to have memory problems) once put it, “trust but verify” with a statistical method that appropriately disciplines the inferences you are making from observations. I’d say that you have been a bit too quick to trust your own eyes & haven’t disciplined them as effectively as you could!
The “glaring problem” in my blog post, you said, was “there is no intragroup relationship in the data– i.e. the magnitude of a person’s Cultural Outlook is not associated with the magnitude of their Environmental Risk Perception.” You invited your readers to corroborate your conclusion “by looking at the above plot” and “cover[ing] up just the black data points. Do you still see a relationship in the data? Try it again by covering up the green data points.”
Hey, I took that test & thought I did see the outline of x<->y correlation in each set of observations, green & black. But I am familiar, & maybe you are too, with people actually disagreeing about what they see when they look at the same thing.
So to discipline my observations, I did a couple of things.
First, I plotted a lowess regression line as well as a fitted one to the data.
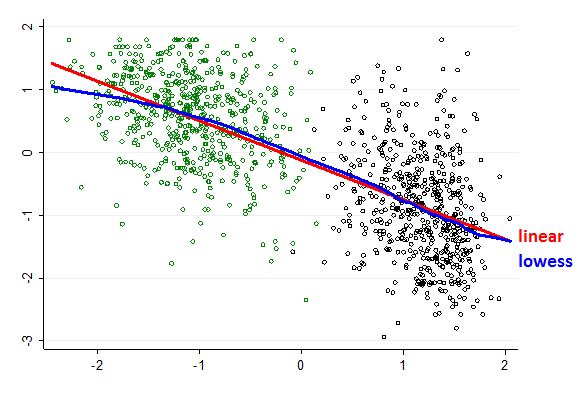
The lowess regression, as you know, chops up the data into tiny little units of x and regresses y separately on each. It is “overfitting” – by design! But it supplies a way to “see” the tendency of the data without being constrained to impute to that relationship the “shape” associated with one or another mathematical function (linear or nonlinear).
Actually, for that reason, it is a good exploratory device for determining whether, when deciding what model to fit to one’s data, it “makes sense” to go with the simplifying assumption that the relationship between the variables of interest is “linear” or instead go with some more complicated but still simplifying assumption about what that relationship is (Jacoby, 2000; Cleveland 1994, pp. 168-80).
Here, it’s pretty clear—to my eyes, at least; how about yours?—that there is both a correlation between x & y in each colored set and that the correlation is pretty darn close to the one that results if one fits a linear model to the entire data set.
Second (and at your suggestion in comments over at “my place”), I fitted regression models “separately” to the green & black observations—that is to the two halves of my data set after I split it at the means on the continuous cultural worldview scales (actually, that split it into four groups; the green & black observations, as I explained in my post, were themselves only half the data). That exercise showed, consistent with the picture pained by the lowess regression but contrary to your prediction, that the R2’s for the green & black sets were significantly different from “zero.”
Or in other words, the analysis disconfirmed your visual surmise that “there is no intragroup relationship in the data.” Relatedly, I demonstrated the same thing by showing that the R2 for a model which treated the cultural outlook variables as continuous was “bigger” than was the R2 for a model that assigned each observation to one discrete cultural “category,” which is the alternative to linear regression that you proposed.
So, indeed, one must not simply trust one’s eyes.
You didn’t, of course. You performed an interesting simulation experiment, on the basis of which you declared that your hypothesis—that there was “no intragroup relationship in the data”—had been confirmed.
But the experiment was poorly designed.
You simulated a data set in which there necessarily was no “intragroup relationship” between two distinct clusters of observations. Because to your eyes it “looked very similar” to my data, you concluded that it “it does not make much sense to use an OLS” regression to analyze the x-y relationship revealed in a scatter plot I posted.
That’s a faulty inference. Indeed, it is an example of “confirmatory hypothesis testing.” For your experiment to give you a reason to treat your hypothesis (“no intragroup relationship” in my data) as corroborated, you have to show that it survives a fair attempt to falsify it, as the two tests I performed did!
A variant of what you did that could have falsified your hypothesis would have been to run a simulation in which there was an “intragroup relationship in the data” and see if it also “looked similar” to my data. If so, that would have shown that the “looks similar” relationship between my data & your simulation has a likelihood ratio of 1: that is, it is as equally consistent with my observations having & not having an “intragroup relationship.”
It’s very clear that one can simulate a data set that “looks similar” to my data and in which there is an “intragroup relationship” among the green & black observations. To do it, all one has to do is run a simulation powered by the parameters of the linear regression model I reported! The result would definitely have “looked” at least as “similar” to my data as the data you simulated with your “no intragroup relationship” algorithm.
What’s the upshot?
Certainly it is incorrect to say that it “does not make much sense to use an OLS” regression” to analyze the data I reported.
In fact, if the goal is to explain as much variance as possible, a linear regression in which the cultural outlook variables are treated as continuous will (as I said) do a better job than one in which the data are assigned (very arbitrarily, by the way; there are no “groups” here—just a continuous variable that one could divide into an infinite number of “groups”) to two groups. The “classification” approach, as you recognize, throws out the information relating to whatever “intragroup” variance in fact exists.
But does that mean that OLS is the “right” model for analyzing the data?
Not necessarily. That depends on what hypothesis one wants to make about the data & what sort of model will best enable a valid conforming or disconfirming inference to be drawn from the data.
So as always, it is boring—boring Boring, BORING!—to talk about “right” or “wrong,” “correct” or “incorrect” models.
Instead, identify an interesting—Interesting, INTERESTING—question, form an interesting (Interesting . . .) hypothesis about it, design a valid (. . .VALID statistical test, and get on with it!
Do you have an interesting hypothesis relating to the nonconformity problem I posed? And a statistical model to test it? I suspect you do.
So please do get on with it & we’ll see how much we can learn!
Refs
Jacoby, W.G. Loess:: A Nonparametric, Graphical Tool for Depicting Relationships between Variables. Electoral Studies 19, 577-613 (2000).
Cleveland, W.S. The Elements of Graphing Data (AT&T Bell Laboratories, Murray Hill, N.J., 1994).
- We also have a strong difference of opinion in how much fun it is to talk about models and the appropriate one to use. I’ll let you, dear reader, figure out which side I’m on.↵
- It’s important to note that there is always a significantly non-zero probability that anything I say is completely wrong. Despite the existence of any strong language or absolute statements, it would be incorrect to think that I am absolutely confident in this or any argument. Beware of people who are.↵
- I think a contrarian argument could be made about the areas which overlap. Right now I don’t have the time to think it through properly.↵